Regression vs classification
ml basics
In the first post we saw that machine learning means learning rules from past examples. The next thing to decide is what kind of answer you want. In trading, for example, predicting a stock’s future return (“how much?”) is a different job from deciding buy, sell or hold (“which one?”).
Two questions about the same trades
From here on, this series uses one made-up example: OTC trade settlement. Two banks agree a trade directly with each other, and on an agreed date the cash and securities must change hands. When that doesn’t happen on time, the trade fails to settle, and fails cost money.
An operations team might ask two different questions:
| Question | Type of answer | ML type |
|---|---|---|
| Will this trade fail to settle? | A category: fail or settle | Classification |
| How many trades will fail tomorrow? | A number: 0, 1, 2, … 149 | Regression |
Same business, same data source. Different questions, so different models.
Classification: “which one?”
The answer is a category (also called a class). Fail or settle. Fraud or normal. Approve, review or reject.
I made up 20,000 trades. For each one we know five facts (the features):
- the trade size in millions of dollars
- whether the two banks’ settlement instructions don’t match (an SSI mismatch)
- whether it’s cross-border
- whether the counterparty is new
- how many hours after the cut-off time it was booked
We also know the answer (the label): 5.9% of the trades failed.
I trained a classifier called logistic regression on 75% of the trades and tested it on the other 25%. (Yes, the name says “regression”, but it’s a classification model. The name is historical, and it confuses everyone.)
A good classifier doesn’t just say “fail” or “settle”. It gives a probability:
- A $20m cross-border trade with a mismatch, a new counterparty and a 4-hour-late booking: 93% chance of failing.
- A $5m domestic trade with clean instructions, booked on time: 2%.
The operations team can now work the riskiest trades first.
The accuracy trap
On the test trades, the model’s accuracy (share of correct answers) was 94.32%. Sounds great. But a “model” that simply says every trade settles is right 94.10% of the time, because only 5.9% of trades fail. It never catches a single fail.
An Introduction to Statistical Learning (ISLP) measures a classifier by its error rate, the share of wrong answers (equation 2.8):
ŷ, the predictiony, the actual valuethe error
where is 1 when the prediction is wrong and 0 when it’s right. Here it’s 5.68%, which is just 100% minus the accuracy.
And here’s the catch: the model only says “fail” when it’s more than 50% sure. At that cut-off it catches just 51 of the 295 trades that really failed. When one answer is rare, accuracy and error rate are close to useless on their own. This is the same lesson as the fraud alert in the probability post: always compare with how rare the event is. For rare events, look at the predicted probabilities, and at how many of the real fails the model catches.
Regression: “how much?”
The answer is a number on a scale. How many fails tomorrow. How many days late. How much a fail will cost.
For this I made up 250 business days. For each day we know how many thousand trades were booked and what share were cross-border, and how many trades failed that day (123 on average). I trained a linear regression model, which finds the best straight-line relationship between the inputs and the answer.
Its forecast for a day with 14,000 trades, 30% of them cross-border: 149 fails. The operations team can plan staff for that.
How you measure a regression model
A regression answer is never exactly right, so you measure how far off it is on average. The standard measure, and the one ISLP uses (equation 2.5), is the mean squared error (MSE):
| Symbol | Meaning |
|---|---|
| number of test days | |
| the real number of fails on day | |
| the model’s prediction for day (read “y-hat”) | |
| the miss, squared: positive either way, and big misses count much more | |
| add up over all the test days |
Here the test MSE is 70.2. The unit is “fails squared”, which is hard to picture, so people usually take the square root to get back to fails. That’s the root mean squared error:
on days that average 123 fails. A simpler alternative is the mean absolute error, , the plain average size of a miss: 6.9 fails per day here. Squaring makes MSE and RMSE punish one big miss more than several small ones, which suits problems like under-staffing on a day with 60 extra fails.
Both, side by side
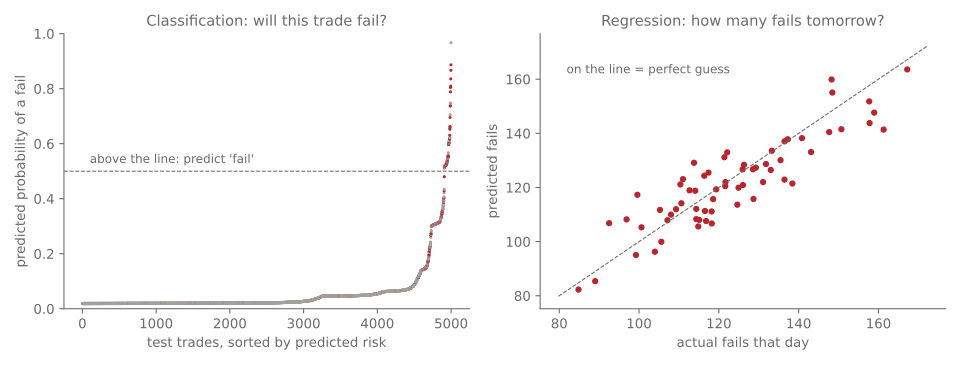
On the left, each dot is a test trade, sorted by predicted risk. Red dots are trades that really failed, and most of them sit at the high end. On the right, each dot is a test day: the closer to the dashed line, the better the forecast.
The code
Both models are a few lines in scikit-learn. The pattern is
always the same: create, fit on past data, predict on new data.
from sklearn.linear_model import LinearRegression, LogisticRegression

# Classification: will this trade fail?   y = 1 (fail) or 0 (settle)
clf = LogisticRegression(max_iter=1000).fit(X_train, y_train)
clf.predict_proba(new_trades)[:, 1]      # probability of a fail, for each trade

# Regression: how many fails tomorrow?    y = number of fails that day
reg = LinearRegression().fit(days_train, fails_train)
reg.predict([[14, 0.30]])                # 14k trades, 30% cross-border -> about 149
How to tell which one you need
| Ask yourself | Regression | Classification |
|---|---|---|
| What does the answer look like? | A number | A category |
| Does “a bit off” make sense? | Yes (148 instead of 149) | No (it’s fail or it isn’t) |
| How do you measure errors? | MSE, RMSE (and MAE) | Error rate, but careful with rare events |
| Finance examples | Fails tomorrow, loss on a loan, tomorrow’s return | Will it fail, will the loan default, buy / sell / hold |
One trick worth knowing: you can often turn one into the other. A trading model can predict tomorrow’s return (regression), and then you buy if the prediction is above some level (classification). Many trading strategies work exactly this way.
Next
In the next post in this series: linear regression, properly. How the “best straight line” is found, what the numbers it learns actually mean, and the maths behind it.
References
- James, Witten, Hastie, Tibshirani and Taylor, An Introduction to Statistical Learning, with Applications in Python (Springer, 2023), section 2.1.5 (regression versus classification) and section 2.2: mean squared error (equation 2.5) and error rate (equation 2.8)
- scikit-learn: linear models